5
Annual Report 2014
5-YEAR PROFIT AND LOSS ACCOUNTS (S$’m)
Turnover
Operating Profit before Tax
Share of (Loss)/Profit of Associated Companies
Income Tax Expense/(Credit)
Net Profit
Non-Controlling Interests
Net Profit Attributable to Equity Holders of the Company
OTHER KEY STATISTICS
Number of Shares (m)
Diluted Earnings per Share (cents)
Dividend per Share (cents)
Dividend Cover (times)
Net Tangible Assets per Share (cents)
Net Asset Value per Share (cents)
Gearing Ratio (net of cash)(times)
Return on Equity (%)
Return on Assets (%)
2010
3,861
402
0
43
359
110
249
2011
4,163
286
1
74
213
73
140
2012
3,734
229
1
60
170
64
106
2013
3,508
61
0
8
53
22
31
2014
4,261
17
0
(9)
26
5
21
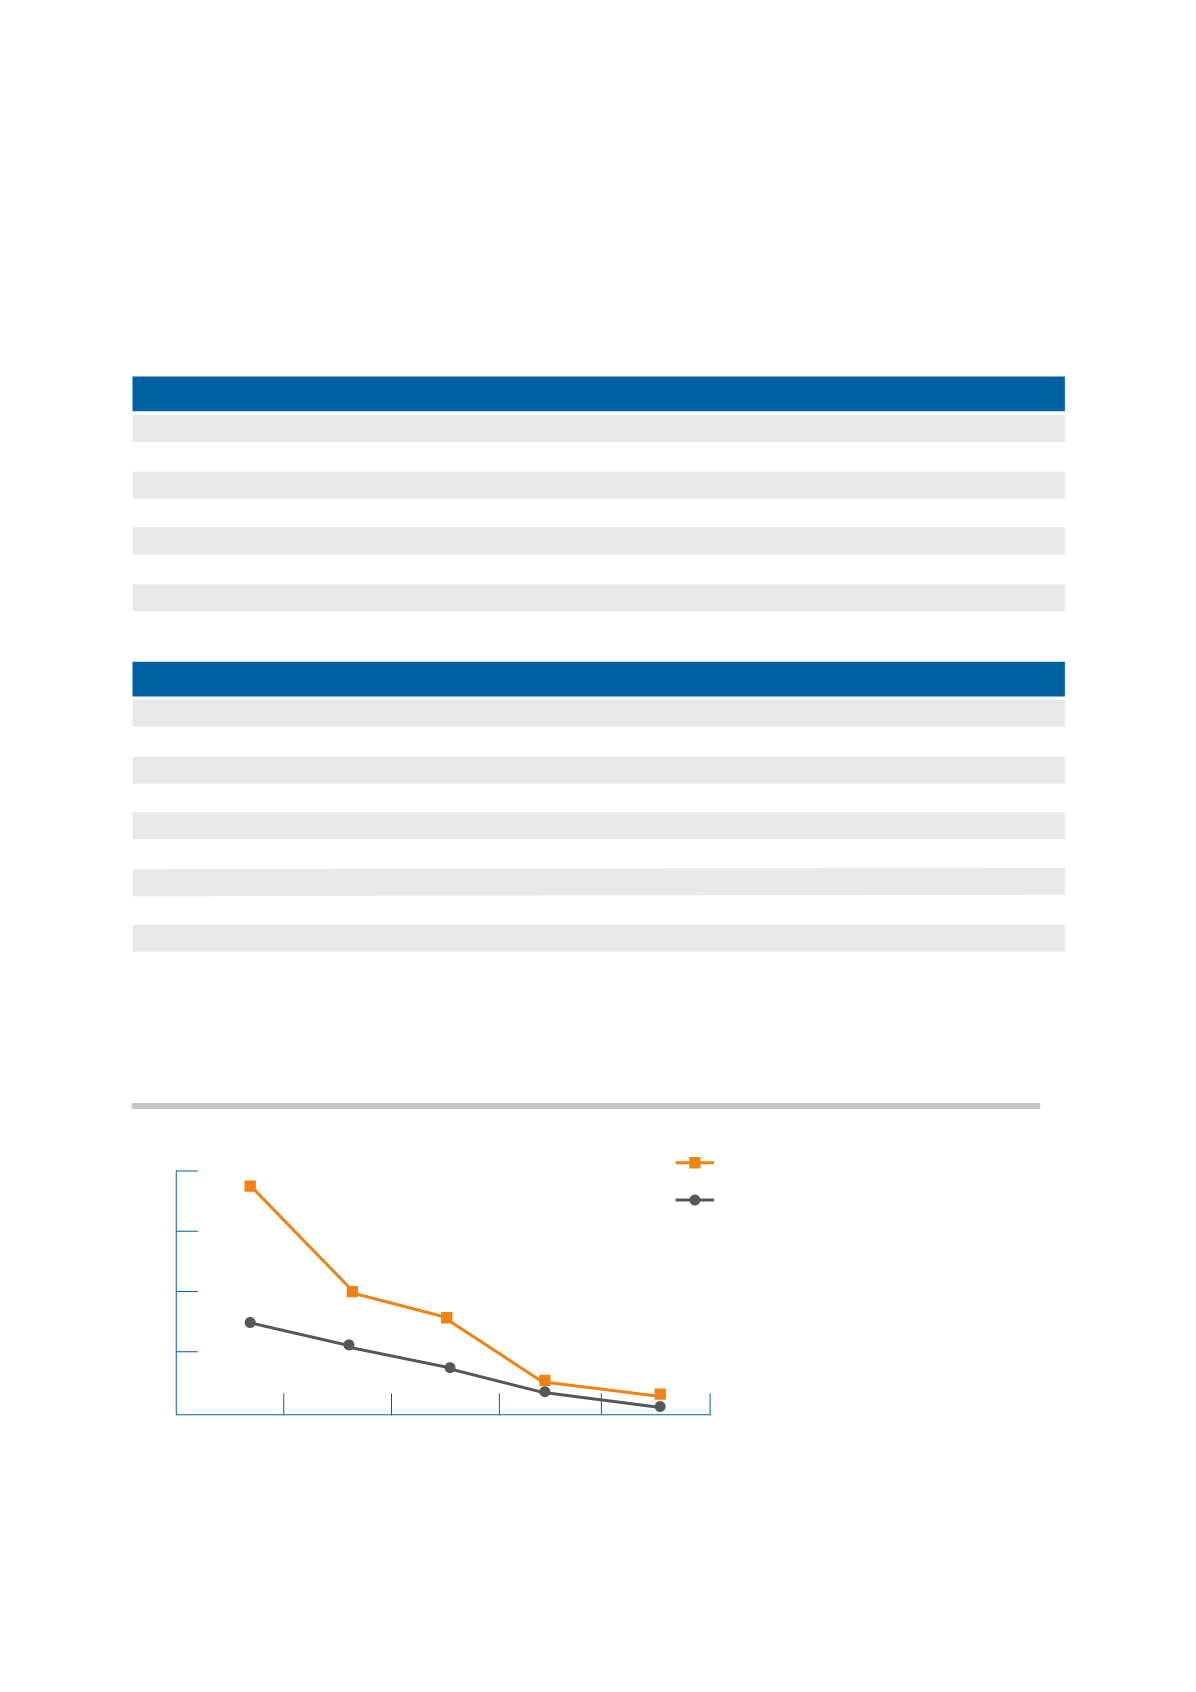
Diluted Earnings per Share (cents)
Dividend per Share (cents)
Dividend Per share (cents)
And Diluted Earnings Per Share (cents)
2013
2014
2010
2011
2012
12
9
6
3
0
4.7
1.4
1.0
11.1
6.2
2.0
3.0
4.0
0.9
0.5
COSCO Overview
2010
2,239.2
11.1
4.0
2.8
53.1
53.5
0.1
21.8
4.0
2011
2,239.2
6.2
3.0
2.1
57.7
58.1
0.4
11.2
2.1
2012
2,239.2
4.7
2.0
2.4
56.8
57.2
1.0
8.2
1.5
2013
2,239.2
1.4
1.0
1.4
59.2
59.7
1.3
2.3
0.4
2014
2,239.2
0.9
0.5
1.9
60.7
61.1
2.5
1.5
0.2


